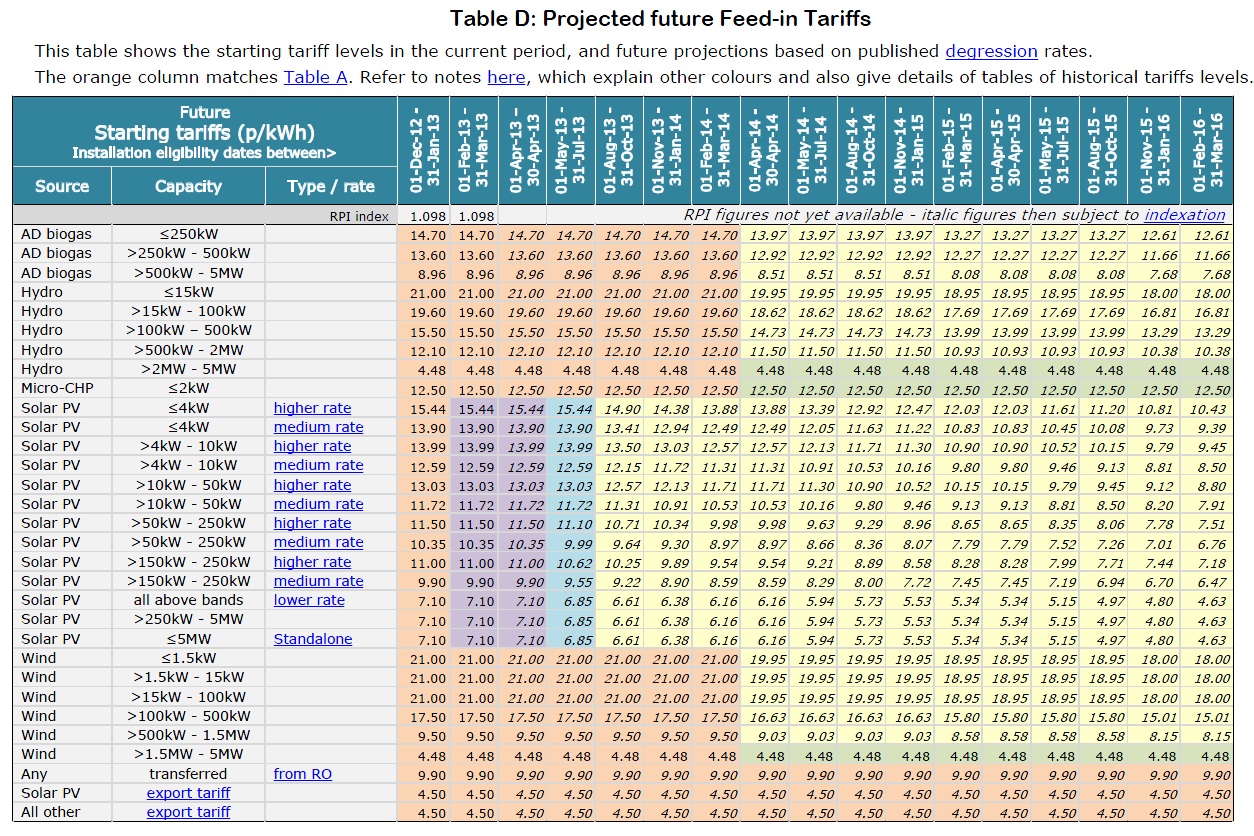
Future tariff levels based on the date of FITs eligibility
We have at last found a way of producing a table of future tariffs, even though changes will be so frequent and so uncertain.
This no longer shows the whole duration of the FITs (it would be impossibly wide with rates changing five times each year), but does show the next 3 years or so. You can make longer term estimates based on the degression factors and an estimate of indexation.
The table at the bottom of the page shows the tariffs applicable to new installations in the current and future periods, based on the published degression rates. A downloadable version is available here.
Notes
Tariffs shown in orange match those that current apply (Table A).
The purple cells show known future degressed tariffs. These are for periods where the relevant deployment figures have been published, so the applicable degression rates are known. Blue cells are based on estimated deployment, where some installation data is available, but the final figures for the period have not yet been published. The yellow cells are estimates of future degressed tariffs, assuming that degression is at the default level. If actual deployment is outside the default corridor, these tariffs will change.
The green cells show tariff levels set by the government in the Phase 2B review, and those which are not subject to degression, but are linked to prices under the Renewables Obligation.
Figures shown in italics will increase when future years indexation figures are published.
Tariffs are all rounded to the nearest 0.1p (0.01p from August 2012). For some reason the government’s figures sometimes round differently to the figures which we and Ofgem calculate, so you might sometimes find small discrepancies. In the end it is Ofgem’s figures which will be applied.Our tariff tables
We used to show all tariffs on a single table, but with all the revisions, rebanding, indexation and degression adjustments, this is no longer possible. We offer the following tables:
- Table A: The starting tariffs on systems being installed in the current period (also shown on the other tables)
- Table B: The tariffs payable this year on systems installed from the start of the scheme (adjusted for indexation)
- Table C: The starting tariffs paid in all periods since the start of the scheme (excluding indexation)
- Table D: These starting tariffs expected in future (adjusted for degression)
Small view of this Table D
Dowloadable version available here.

